How to Use the Shade Data Map in Tree Equity Score

What is Tree Equity Score?

American Forests developed Tree Equity Score to measure how well the critical benefits of the urban tree canopy are reaching those who need them most. The score establishes an equity-first standard to guide investment in areas with the greatest need. Tree Equity Score combines information from a variety of sources to create a single measure from 0 to 100. The lower the score, the greater the need for investment.

Shade data is now available in Tree Equity Score!

Shade is one of the most effective ways to cool people outside when it is hot. Shade can be cast by any vertical feature in the city, including trees and buildings. Maps of urban shade infrastructure are not widely available, and the UCLA Luskin Center of Innovation and American Forests have teamed up to expand access to information about this critical cooling resource in cities. With new shade data in Tree Equity Score, communities can now determine the percent shade at noon (minimum shade), 3 p.m., and 6 p.m. (maximum shade) and the share of shade produced by trees and by buildings within Census block groups. Knowledge of percent shade cover at various times throughout the day helps communities plan for increased shade cover and access. The data is currently available for over 100 urban areas.

Learn how cities can use shade to manage heat.

Check out three immersive stories to explore how Austin, TX, Detroit, MI, and Phoenix, AZ, can use shade to plan for safe school routes, bus stops, and public parks!

Research Team

1. Accessing the Tree Equity Score map

  • Go to the Tree Equity Score National Explorer → www.TreeEquityScore.org/Map
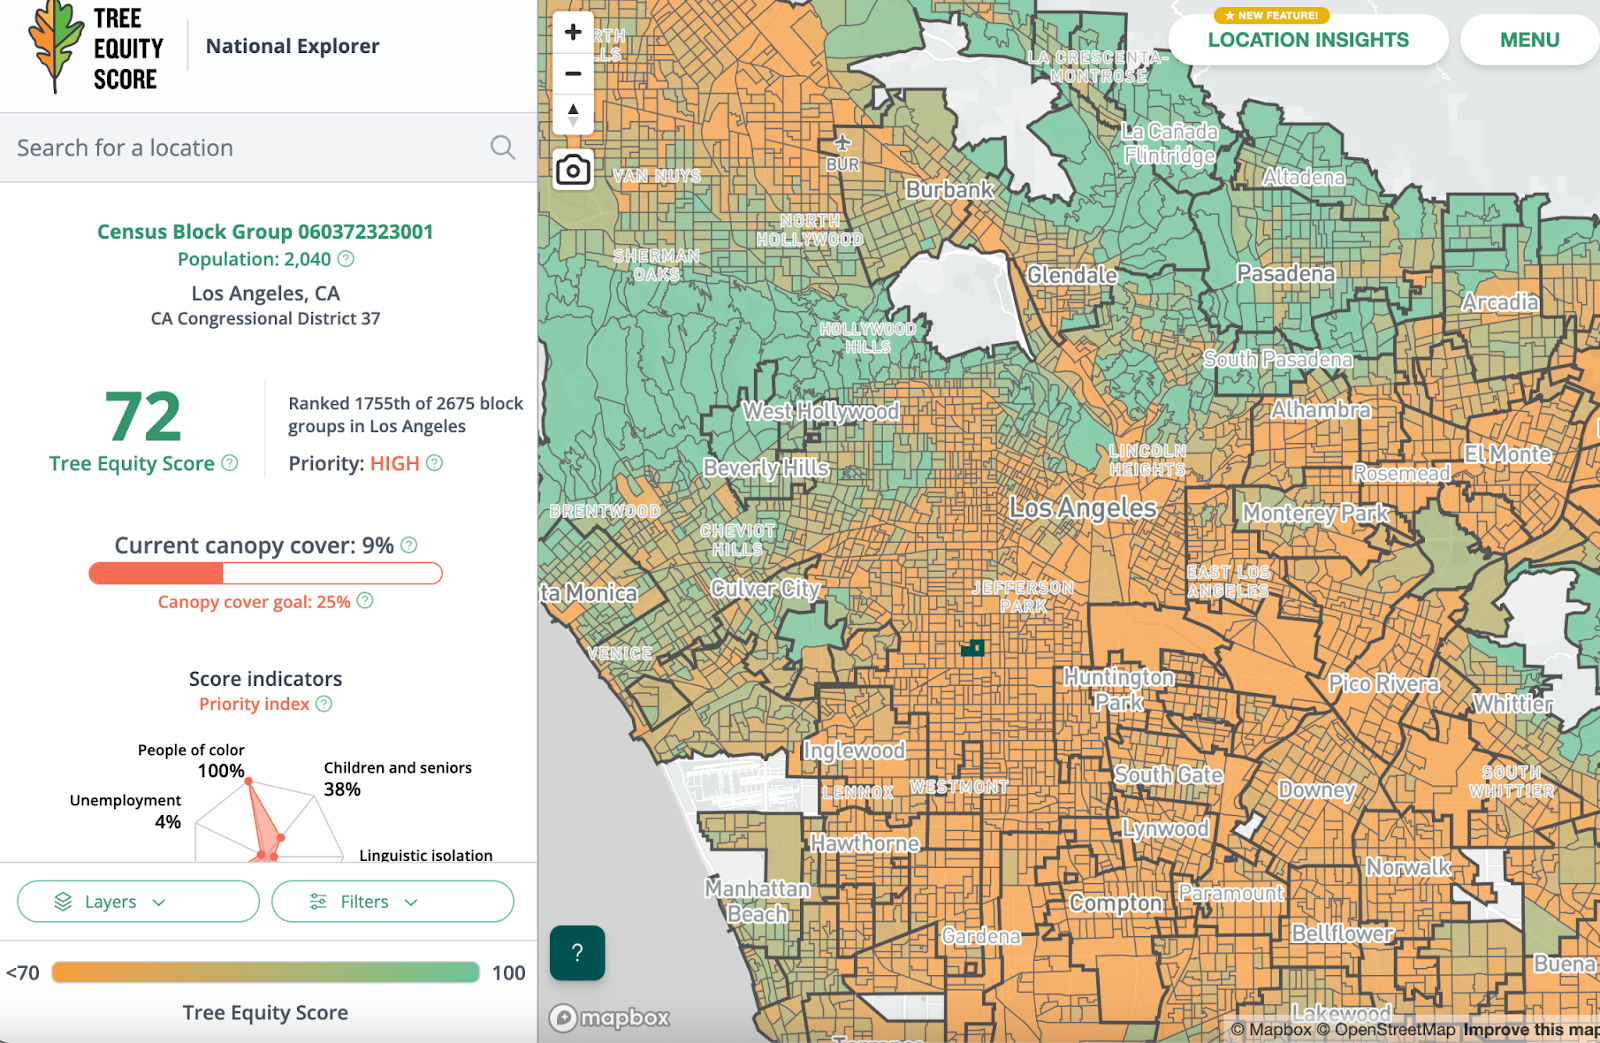
  • Enter an address into the Search Bar near the top left corner or pan and zoom the map using manual controls + / – located at the top left corner of the map.
  • Hover or click over shaded areas on the map to view scores for different locations.
  • As you zoom in, localities will subdivide into Census block groups.
  • To learn more about an area, click on a Census block to highlight it. Additional information, such as percent people of color and percent unemployment, will appear in the sidebar on the left.

Figure 1: Tree Equity Score Homepage

2. Locate the shade data layer

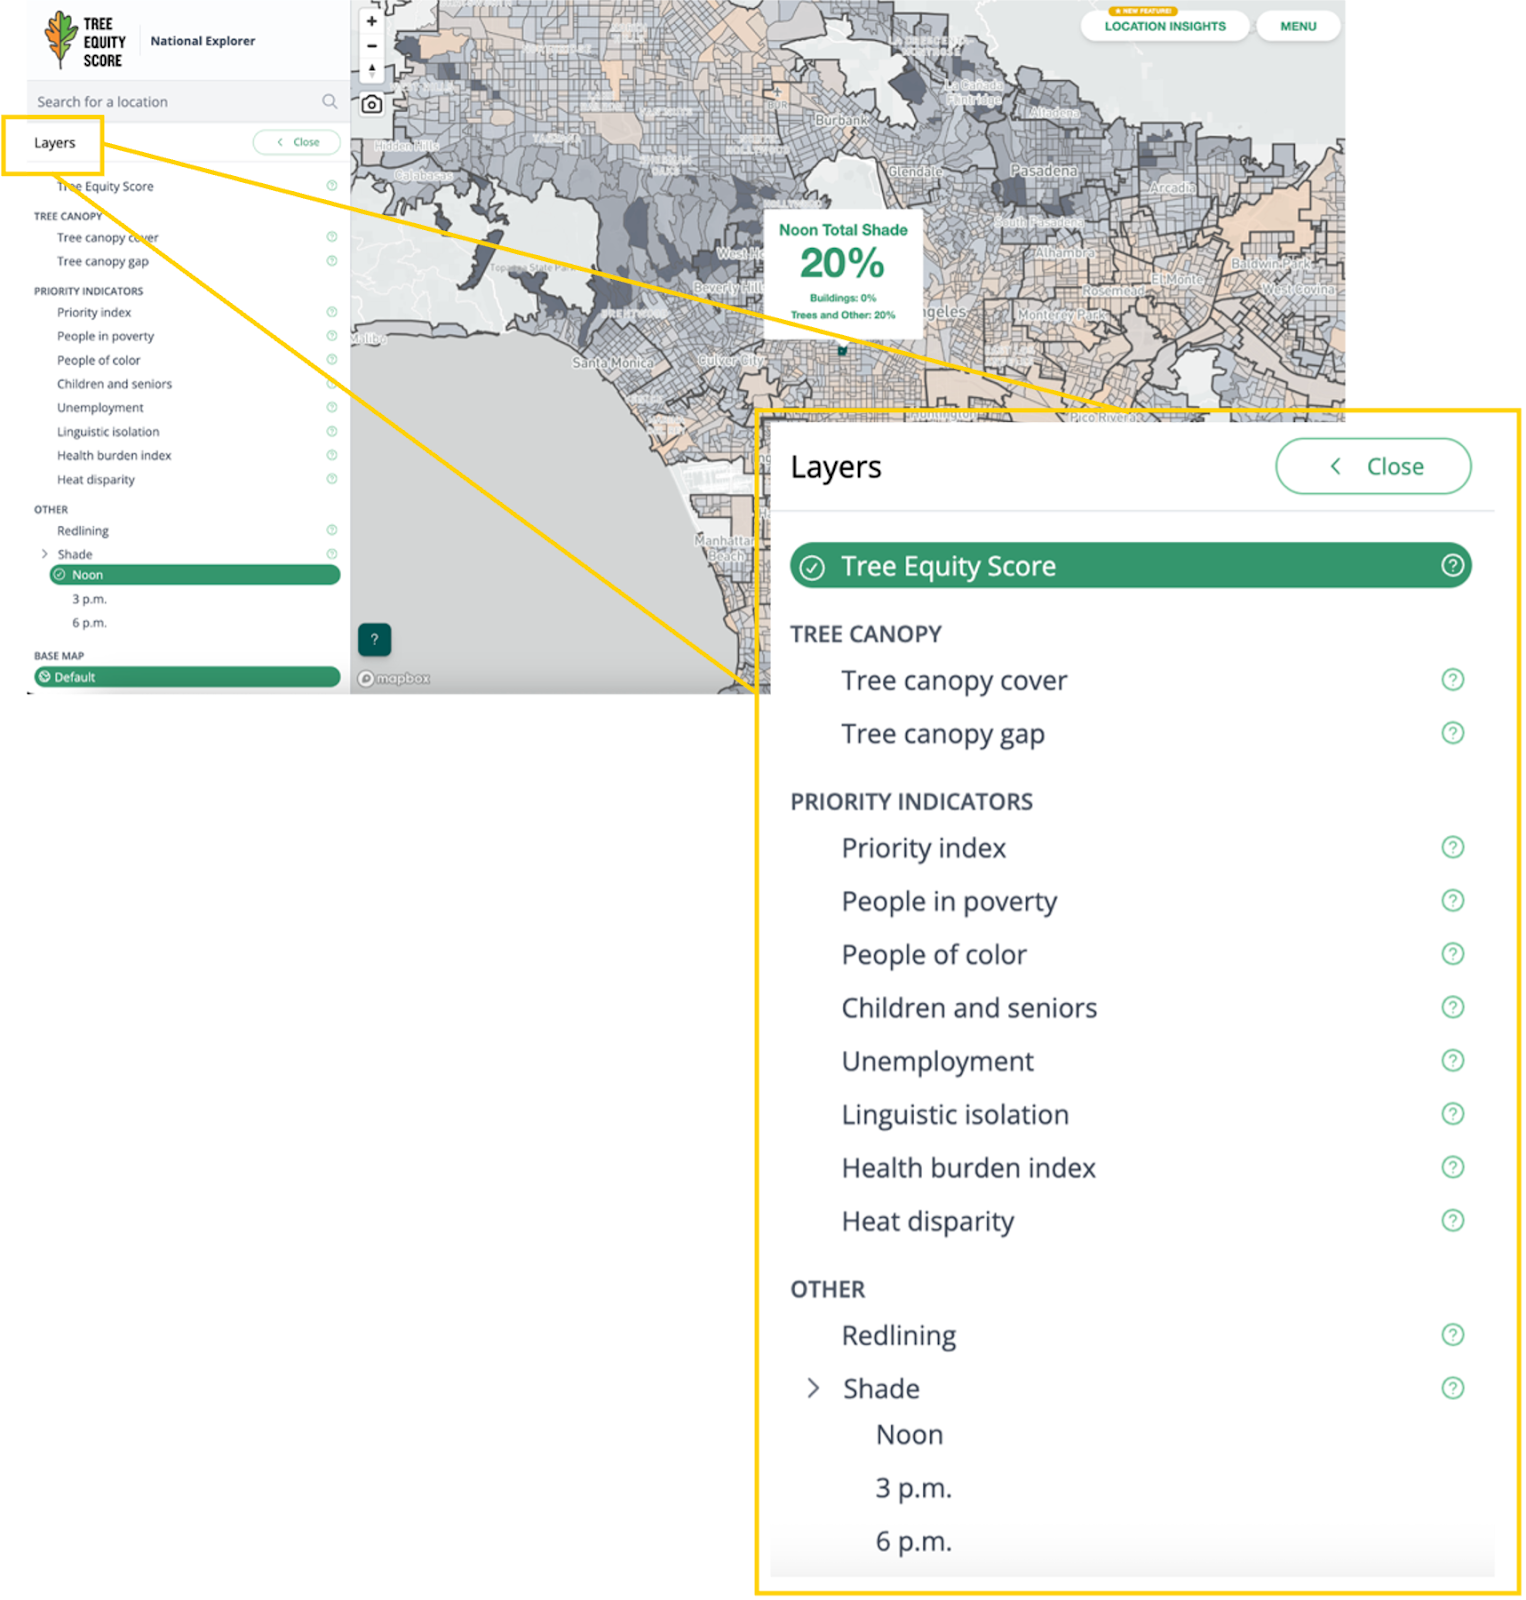
  • Go to the Layers menu at the bottom left corner of the sidebar, and select Shade.
  • Explore shade at noon, 3 p.m., and 6 p.m.
  • Hover over the map to find the total shade percentage for each Census block group, as well as tree and building shade percentages.

Figure 2: Inset Map Displaying the Layers Tab Interface

3. Use filters to specialize your search

  • A map filter is a tool that allows you to narrow down or prioritize the information displayed based on specific criteria. Map filters help you focus on the geographic areas that are most relevant to your interests.
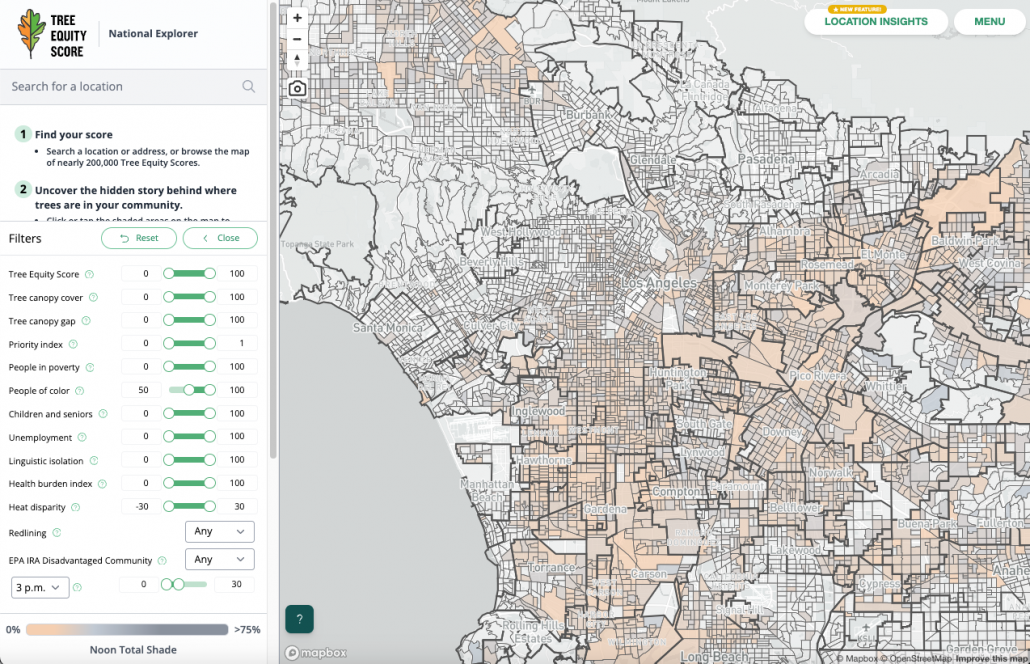
  • Click on Filters at the bottom left corner of the sidebar to open the filter menu. (If the layers tab is open, first close it.)
  • Adjust the sliders from either end or enter cutoff values. The filter will modify the map display accordingly, “filtering out” the areas that do not meet your criteria, and leaving only the areas that match the filter criteria visible on the map. You can set one or more filters.
    • You can also filter Census block groups by the amount of shade.
  • Filter the map using one shade layer timestamp — choose between noon, 3 p.m., and 6 p.m.
  • Filters remain active even after closing the filters menu or changing map layers. To restore the default filters, click the Reset button.

Figure 3: Navigating Options Within the Filters Tab

As an example, this screen capture uses filters to display Census block groups with 0 – 30% total shade cover at 3 p.m. where the percentage of people of color is 50% or higher.

4. Download data

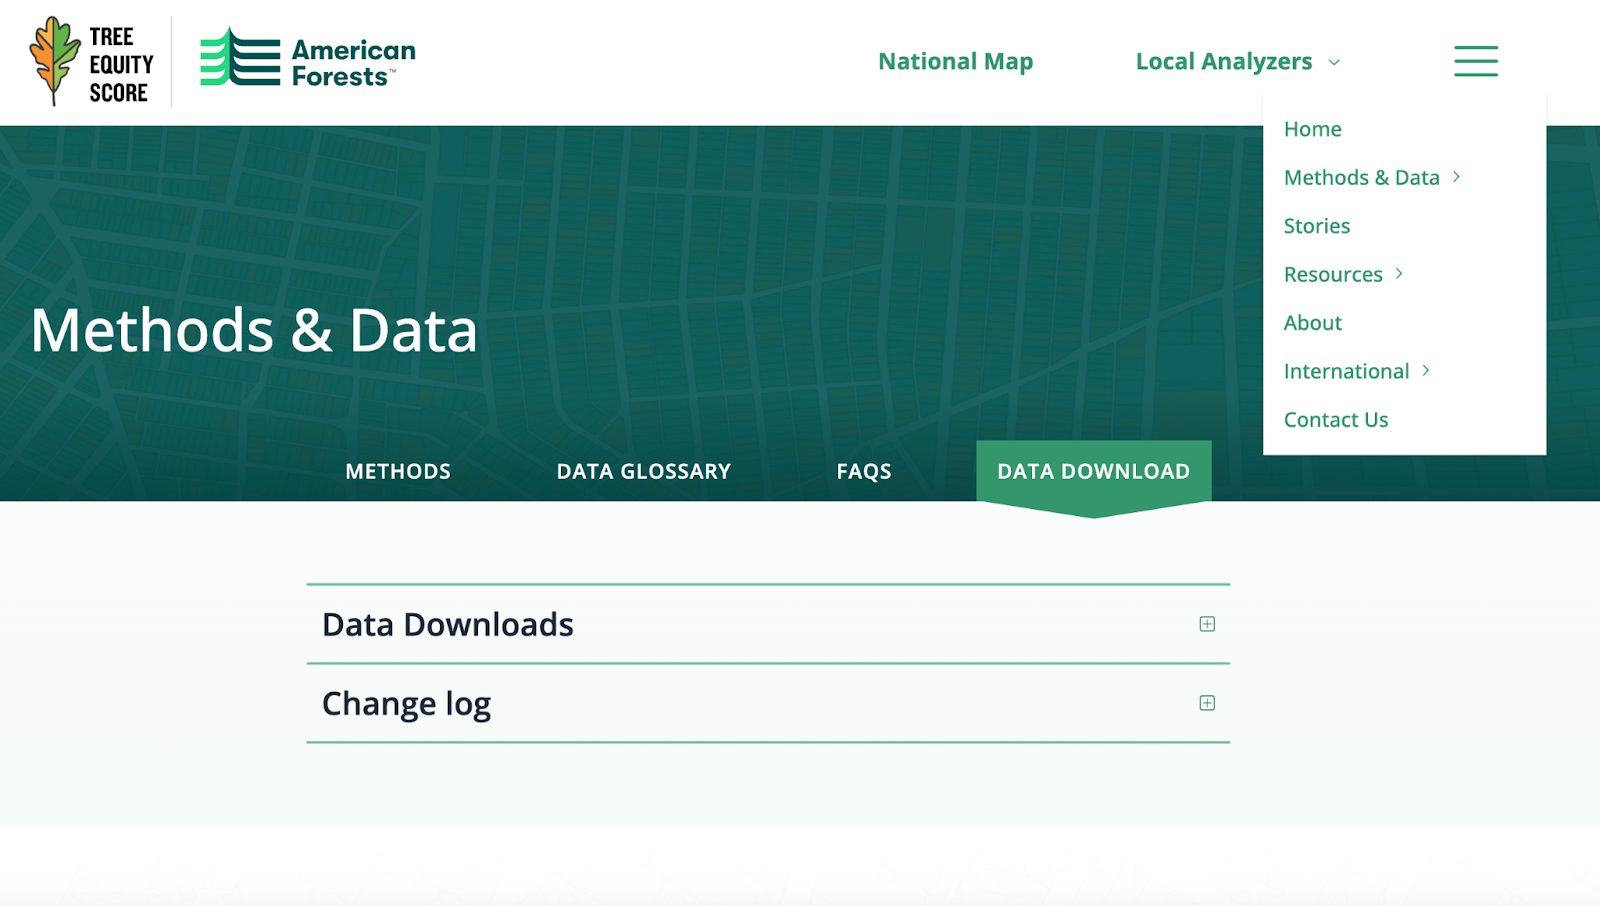
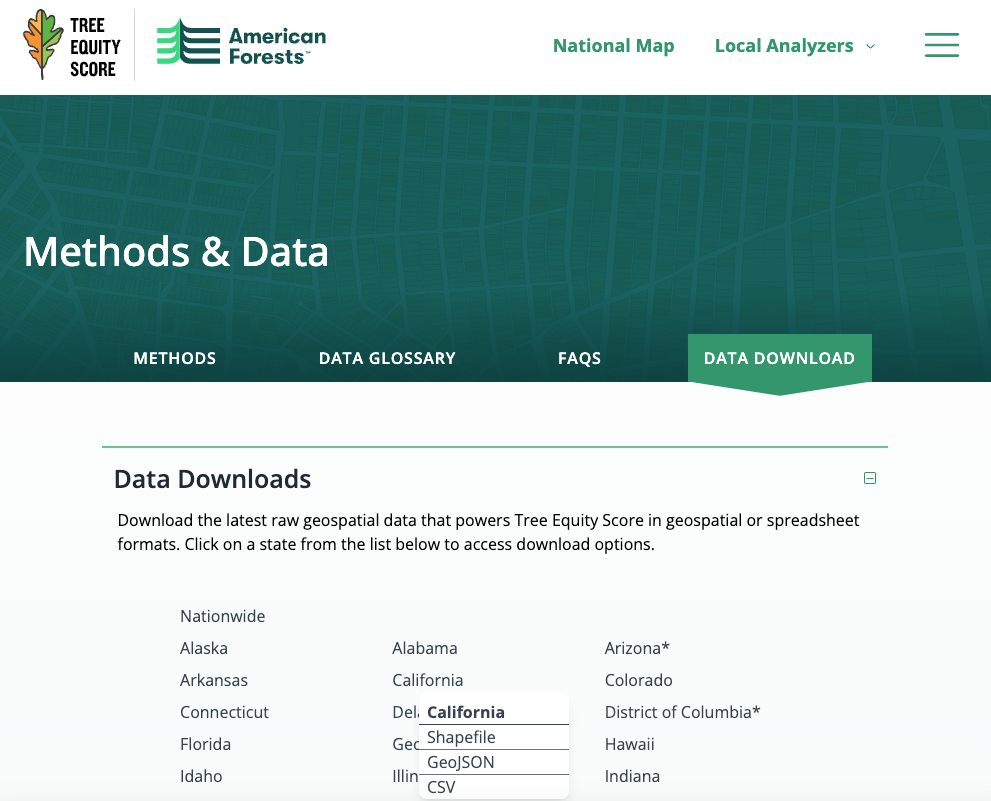
  • To download nationwide or state Tree Equity Score data, go to the home page, then click Methods & Data, then Data Download toward the top right corner in the main menu.
  • Download as a Shapefile, GeoJSON, or CSV for 38 states. Check if your state has shade data available in the National Explorer.

Figure 4: Data Downloads Selection

Example exploration

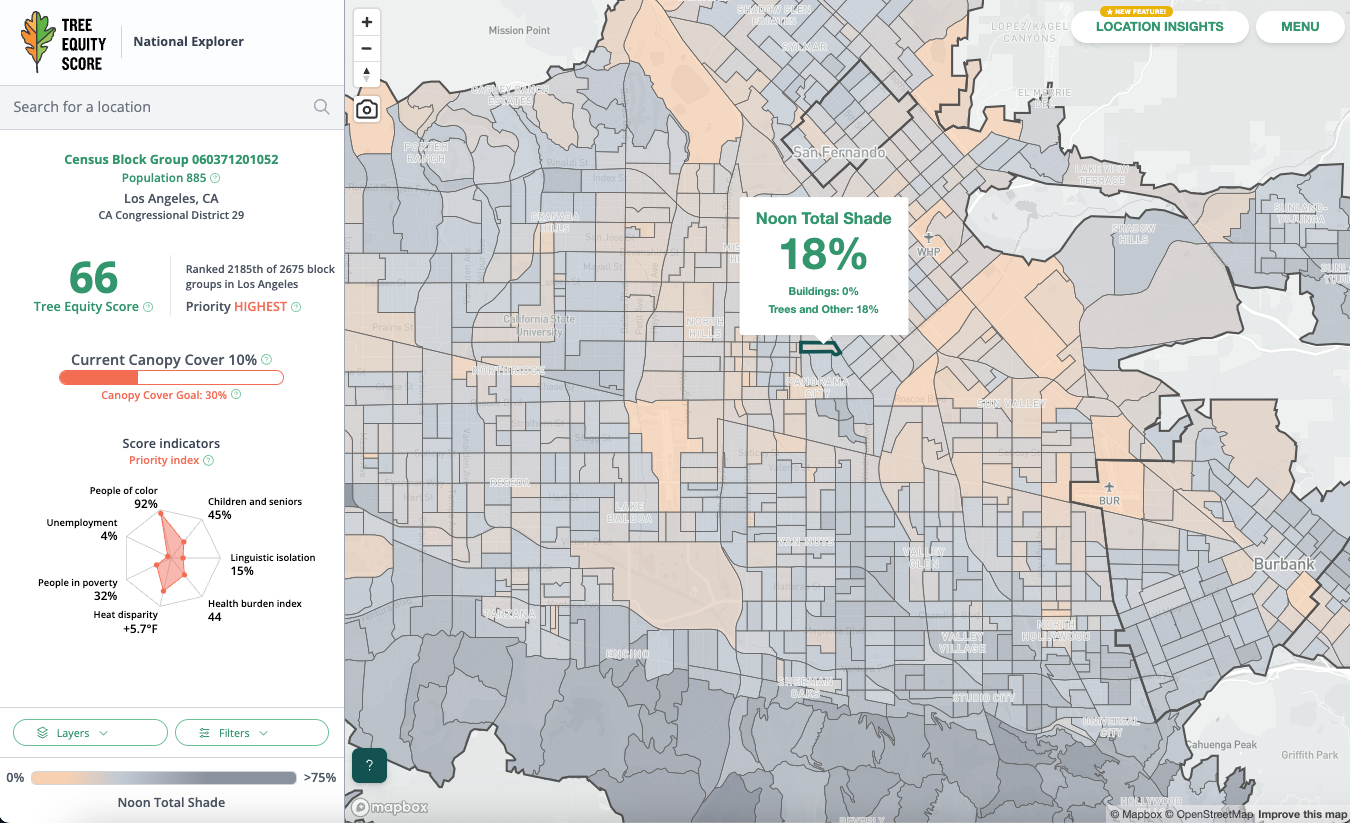
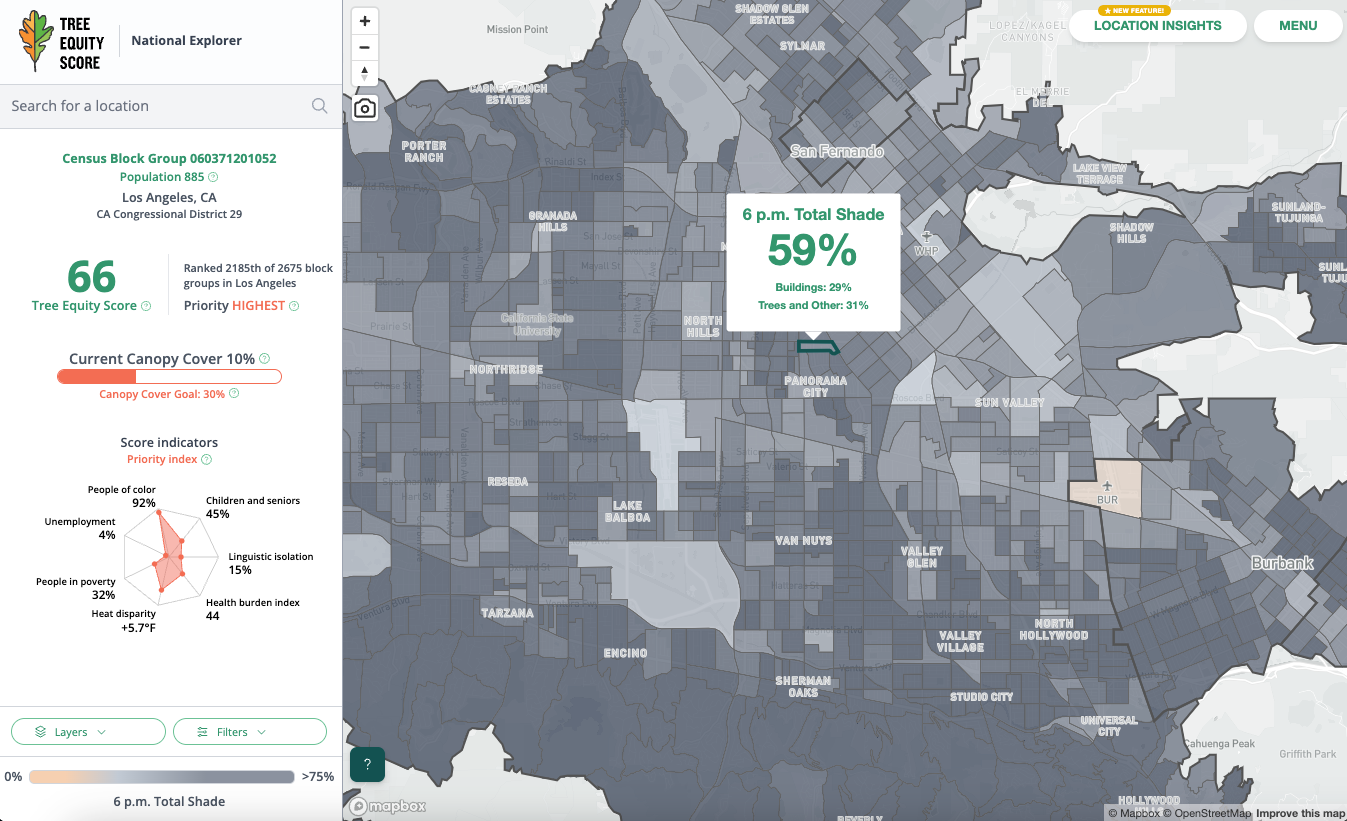
At the displayed Census block group (CBG 060371201052), there is 18% shade cover at noon. By 6 p.m., the total shade cover increases to 59%. The percentage of people of color in the Census block group is 92%.

Figure 5: Example Data Sample