Extreme heat is a growing problem for California’s schools. Lack of air conditioning leaves classrooms too hot to maximize learning, while lack of shade puts students at risk in schoolyards. The problems and solutions are more complex than one might think — tradeoffs abound, and the tension between state and local responsibility and control is palpable.
To present a simple starting point for understanding how heat affects students, we’ve put together a set of fact sheets and infographics that boil down lots of complexity into a few brief pages. Below, our infographics layout The Problem with Hot Schoolyards and The Problem with Hot Classrooms, with a few paragraphs on each to provide context and citations.
The Problem with Hot Schoolyards
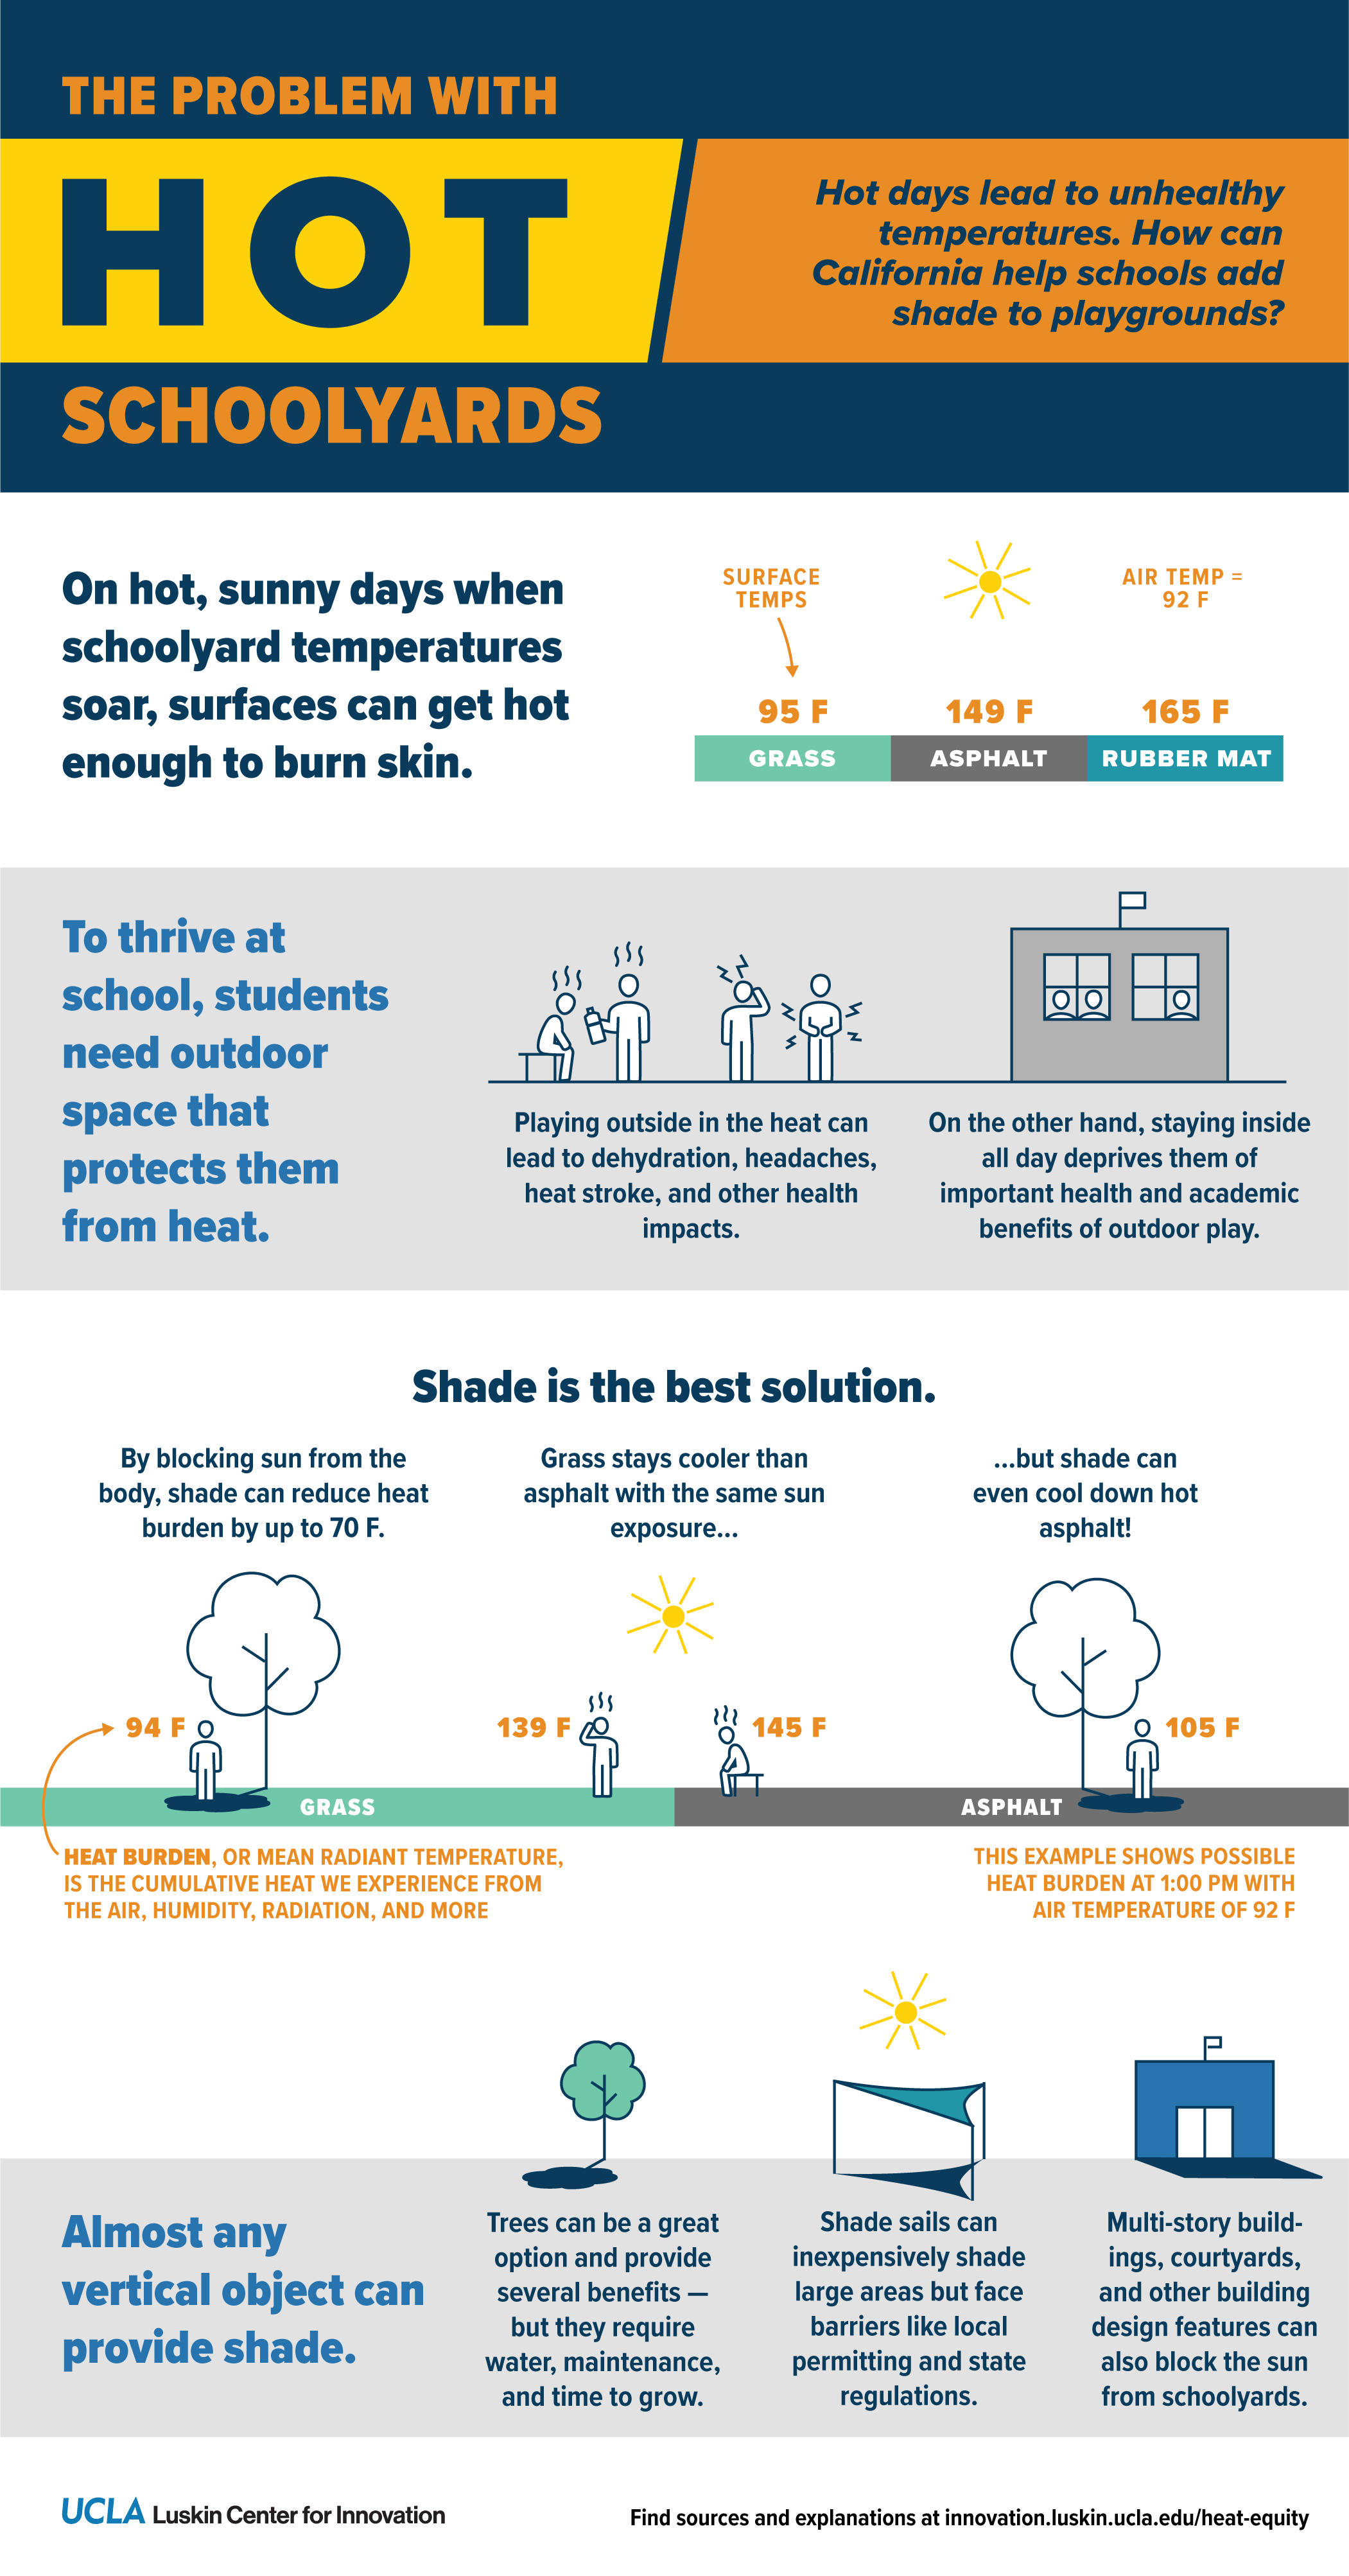
This infographic lays out some basics to illustrate why overheated outdoor play areas are a problem for students. Here are some contextualizing details and citations:
- Surface temperature: The surface temperatures listed in the graphic are actual temperatures measured at or near an elementary school in Pacoima, a neighborhood in Los Angeles. The measurements were taken when the air temperature was 91 to 92 degrees Fahrenheit. Source: Turner et al. 2023. “Site Design and Human Heat Burden in Pacoima, California.”
- Heat burden: Heat burden is a colloquial term for mean radiant temperature, or MRT, which measures the net heat exposure from multiple sources: air, humidity, wind, incoming short and longwave radiation, radiant heat from surface, etcetera. The numbers for heat burden in this graphic come from a model that estimates MRT for different shade and surface scenarios at 1:00 pm at that same school in Pacoima. Source: Turner et al. 2023. “Site Design and Human Heat Burden in Pacoima, California.”
To learn more, read our fact sheet, “Protecting Students from Heat Outdoors,” or our policy brief, “Protecting Californians with Heat-Resilient Schools,” both of which are accessible here.
The Problem with Hot Classrooms
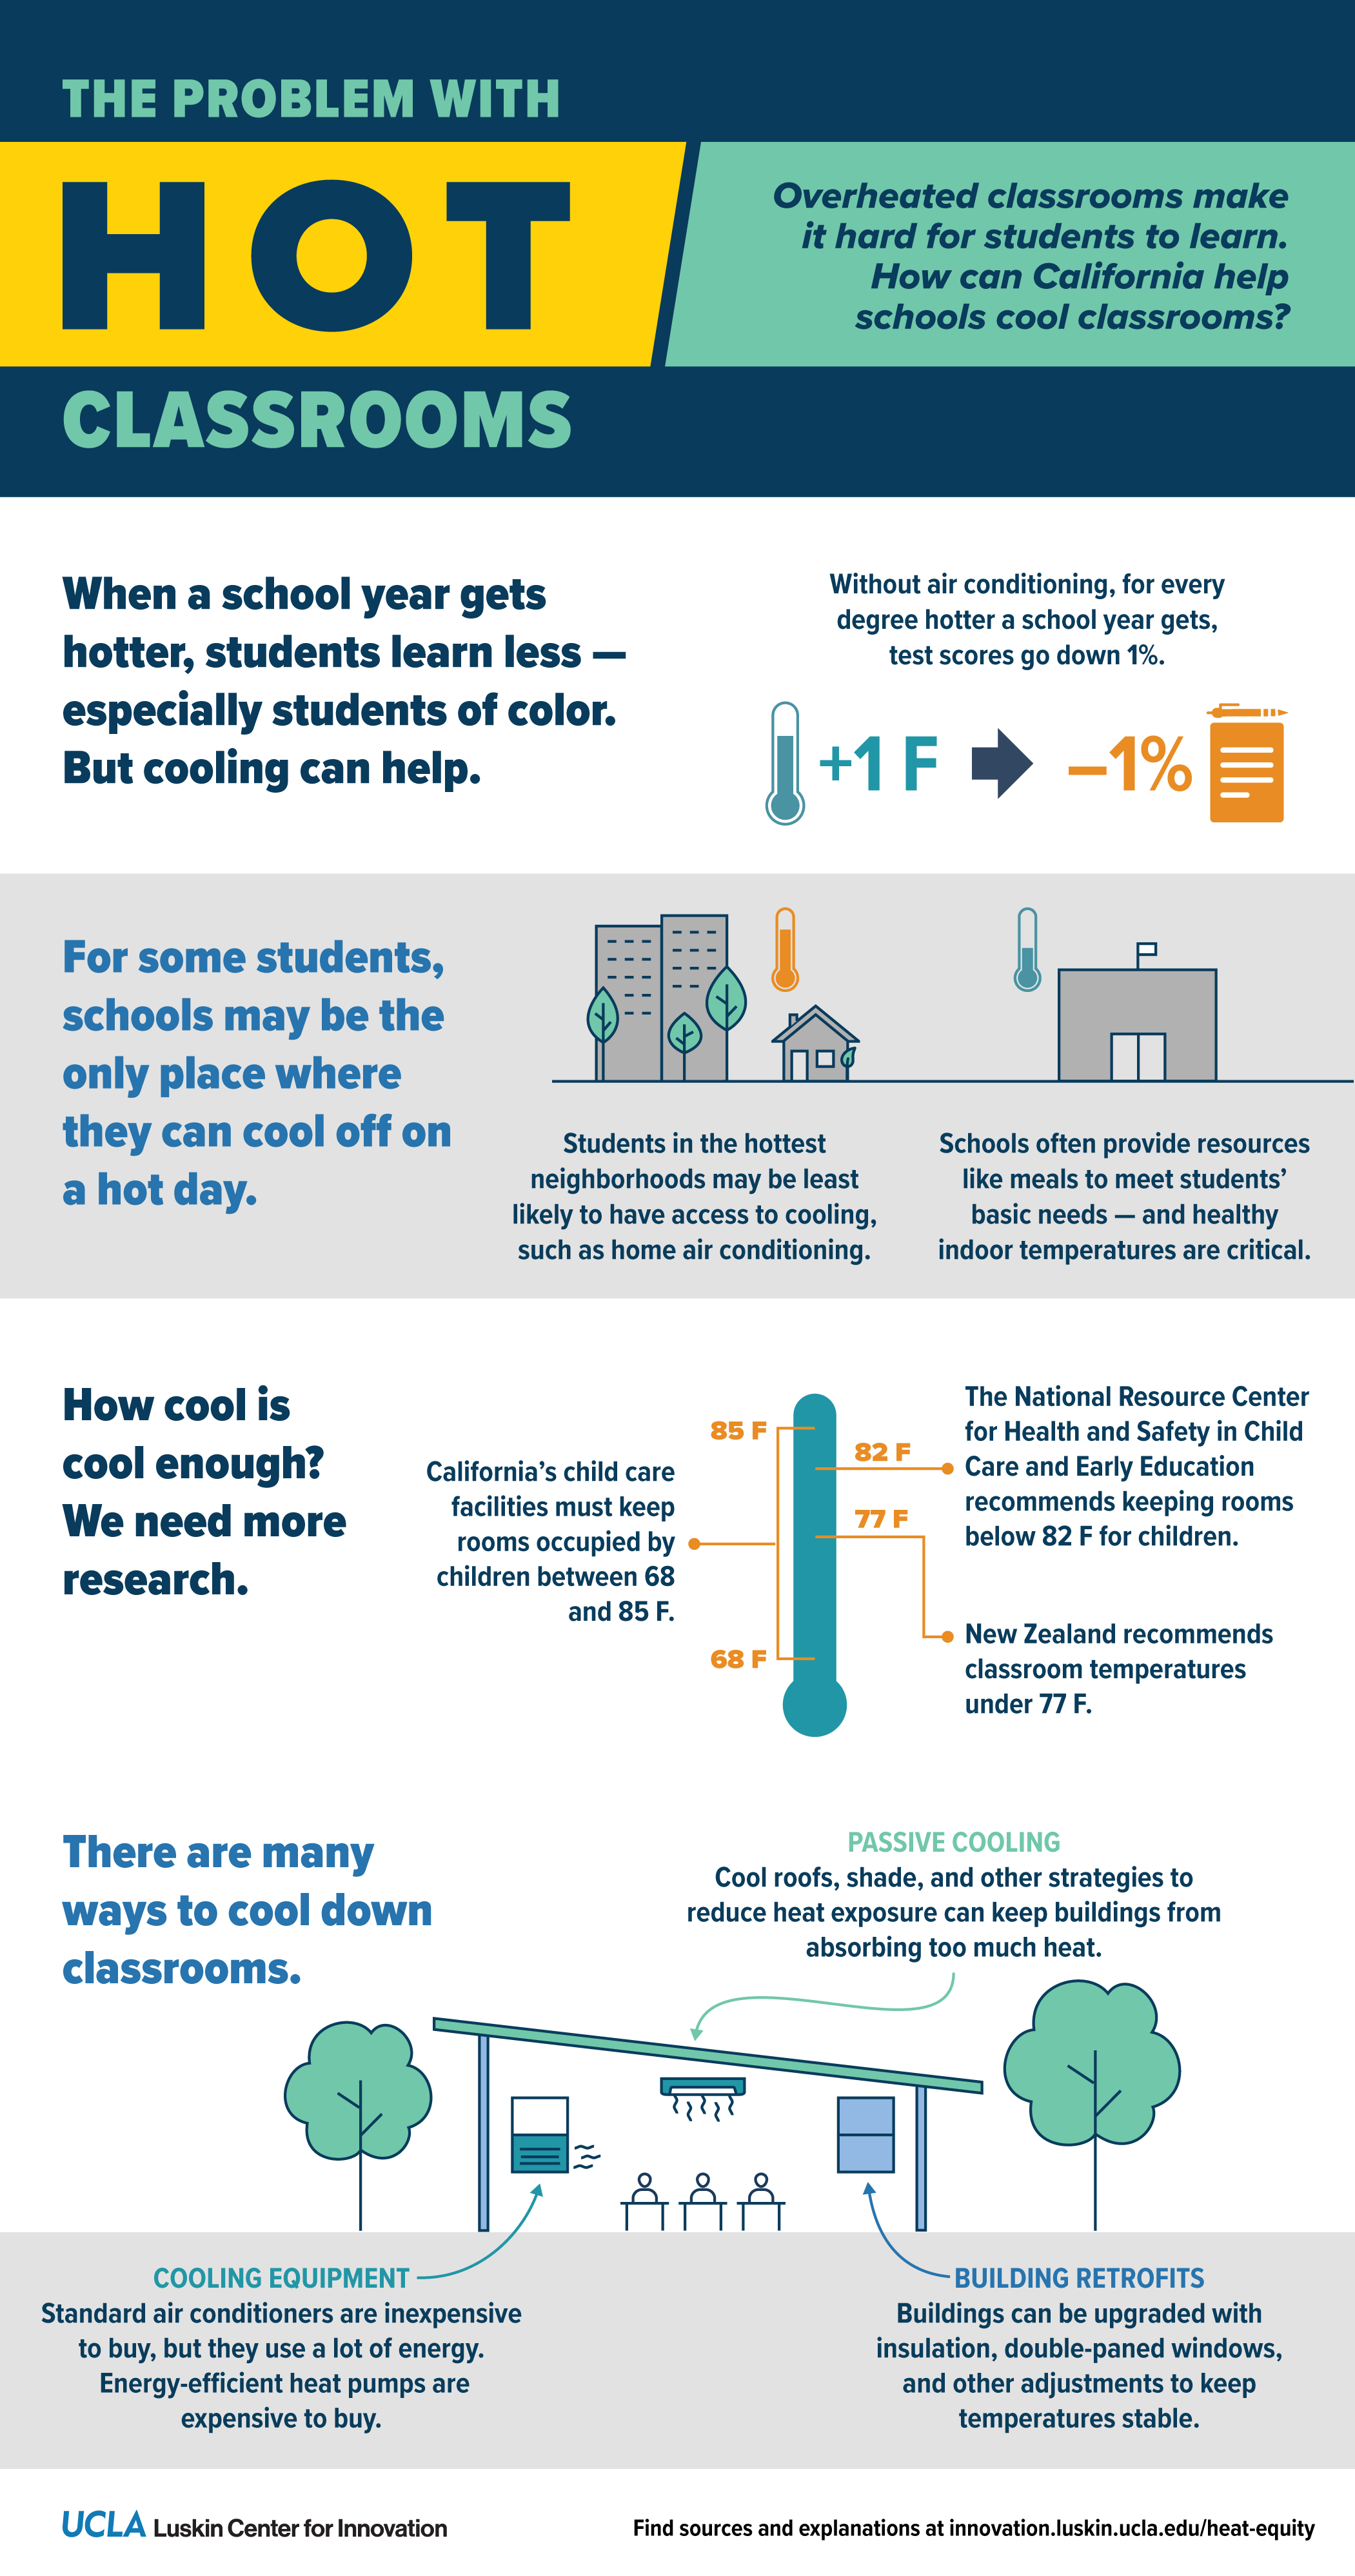
This infographic lays out some basics to illustrate why overheated classrooms are a problem for students. Here are some contextualizing details and citations:
- Test scores: Park and colleagues (2020) showed that without cooling equipment in classrooms, an increase in average school year temperature of 1 degree Fahrenheit leads to 1% less learning for that year, as measured by changes in test scores. Source: Park, R. Jisung, Joshua Goodman, Michael Hurwitz, and Jonathan Smith. 2020. “Heat and Learning.” American Economic Journal: Economic Policy, 12 (2): 306-39.
To learn more, read our fact sheet, “Cooling Classrooms to Healthy Temperatures,” or our policy brief, “Protecting Californians with Heat-Resilient Schools,” both of which are accessible here.
Authors
- V. Kelly Turner, associate director
- Ruth Engel, project manager for environmental data science
- Lauren Dunlap, project manager for energy research
Funding Acknowledgements
Funding for this project was provided by the Resources Legacy Fund.


