• Letter from the Director
  • Strategic Roadmap
  • 2025 Impact Report
  • Contact
    Us
  • Give
    Now
UCLA Luskin Center for Innovation
  • About
    • Mission, Approach, & Values
    • Policy Impacts & History
    • Team
    • Advisory Board
    • Collaborators
    • Student Opportunities
  • Research
    • Current Projects
    • Climate
    • Energy
    • Fire Hub
    • Heat
    • Transportation
    • Urban Greening
    • Water
    • All Publications
  • News
  • Events
    • Calendar
    • Webinar Library
  • Support
    • Giving Opportunities
    • Support Students
  • Subscribe
  • Media
    • Select Media Coverage
    • Contact Our Experts
  • Click to open the search input field Click to open the search input field Search
  • Menu Menu
  • The Problem with Hot Schools

    Infographics on Heat-Resilient Schools

Extreme heat is a growing problem for California’s schools. Lack of air conditioning leaves classrooms too hot to maximize learning, while lack of shade puts students at risk in schoolyards. The problems and solutions are more complex than one might think — tradeoffs abound, and the tension between state and local responsibility and control is palpable.

To present a simple starting point for understanding how heat affects students, we’ve put together a set of fact sheets and infographics that boil down lots of complexity into a few brief pages. Below, our infographics layout The Problem with Hot Schoolyards and The Problem with Hot Classrooms, with a few paragraphs on each to provide context and citations.

The Problem with Hot Schoolyards
test

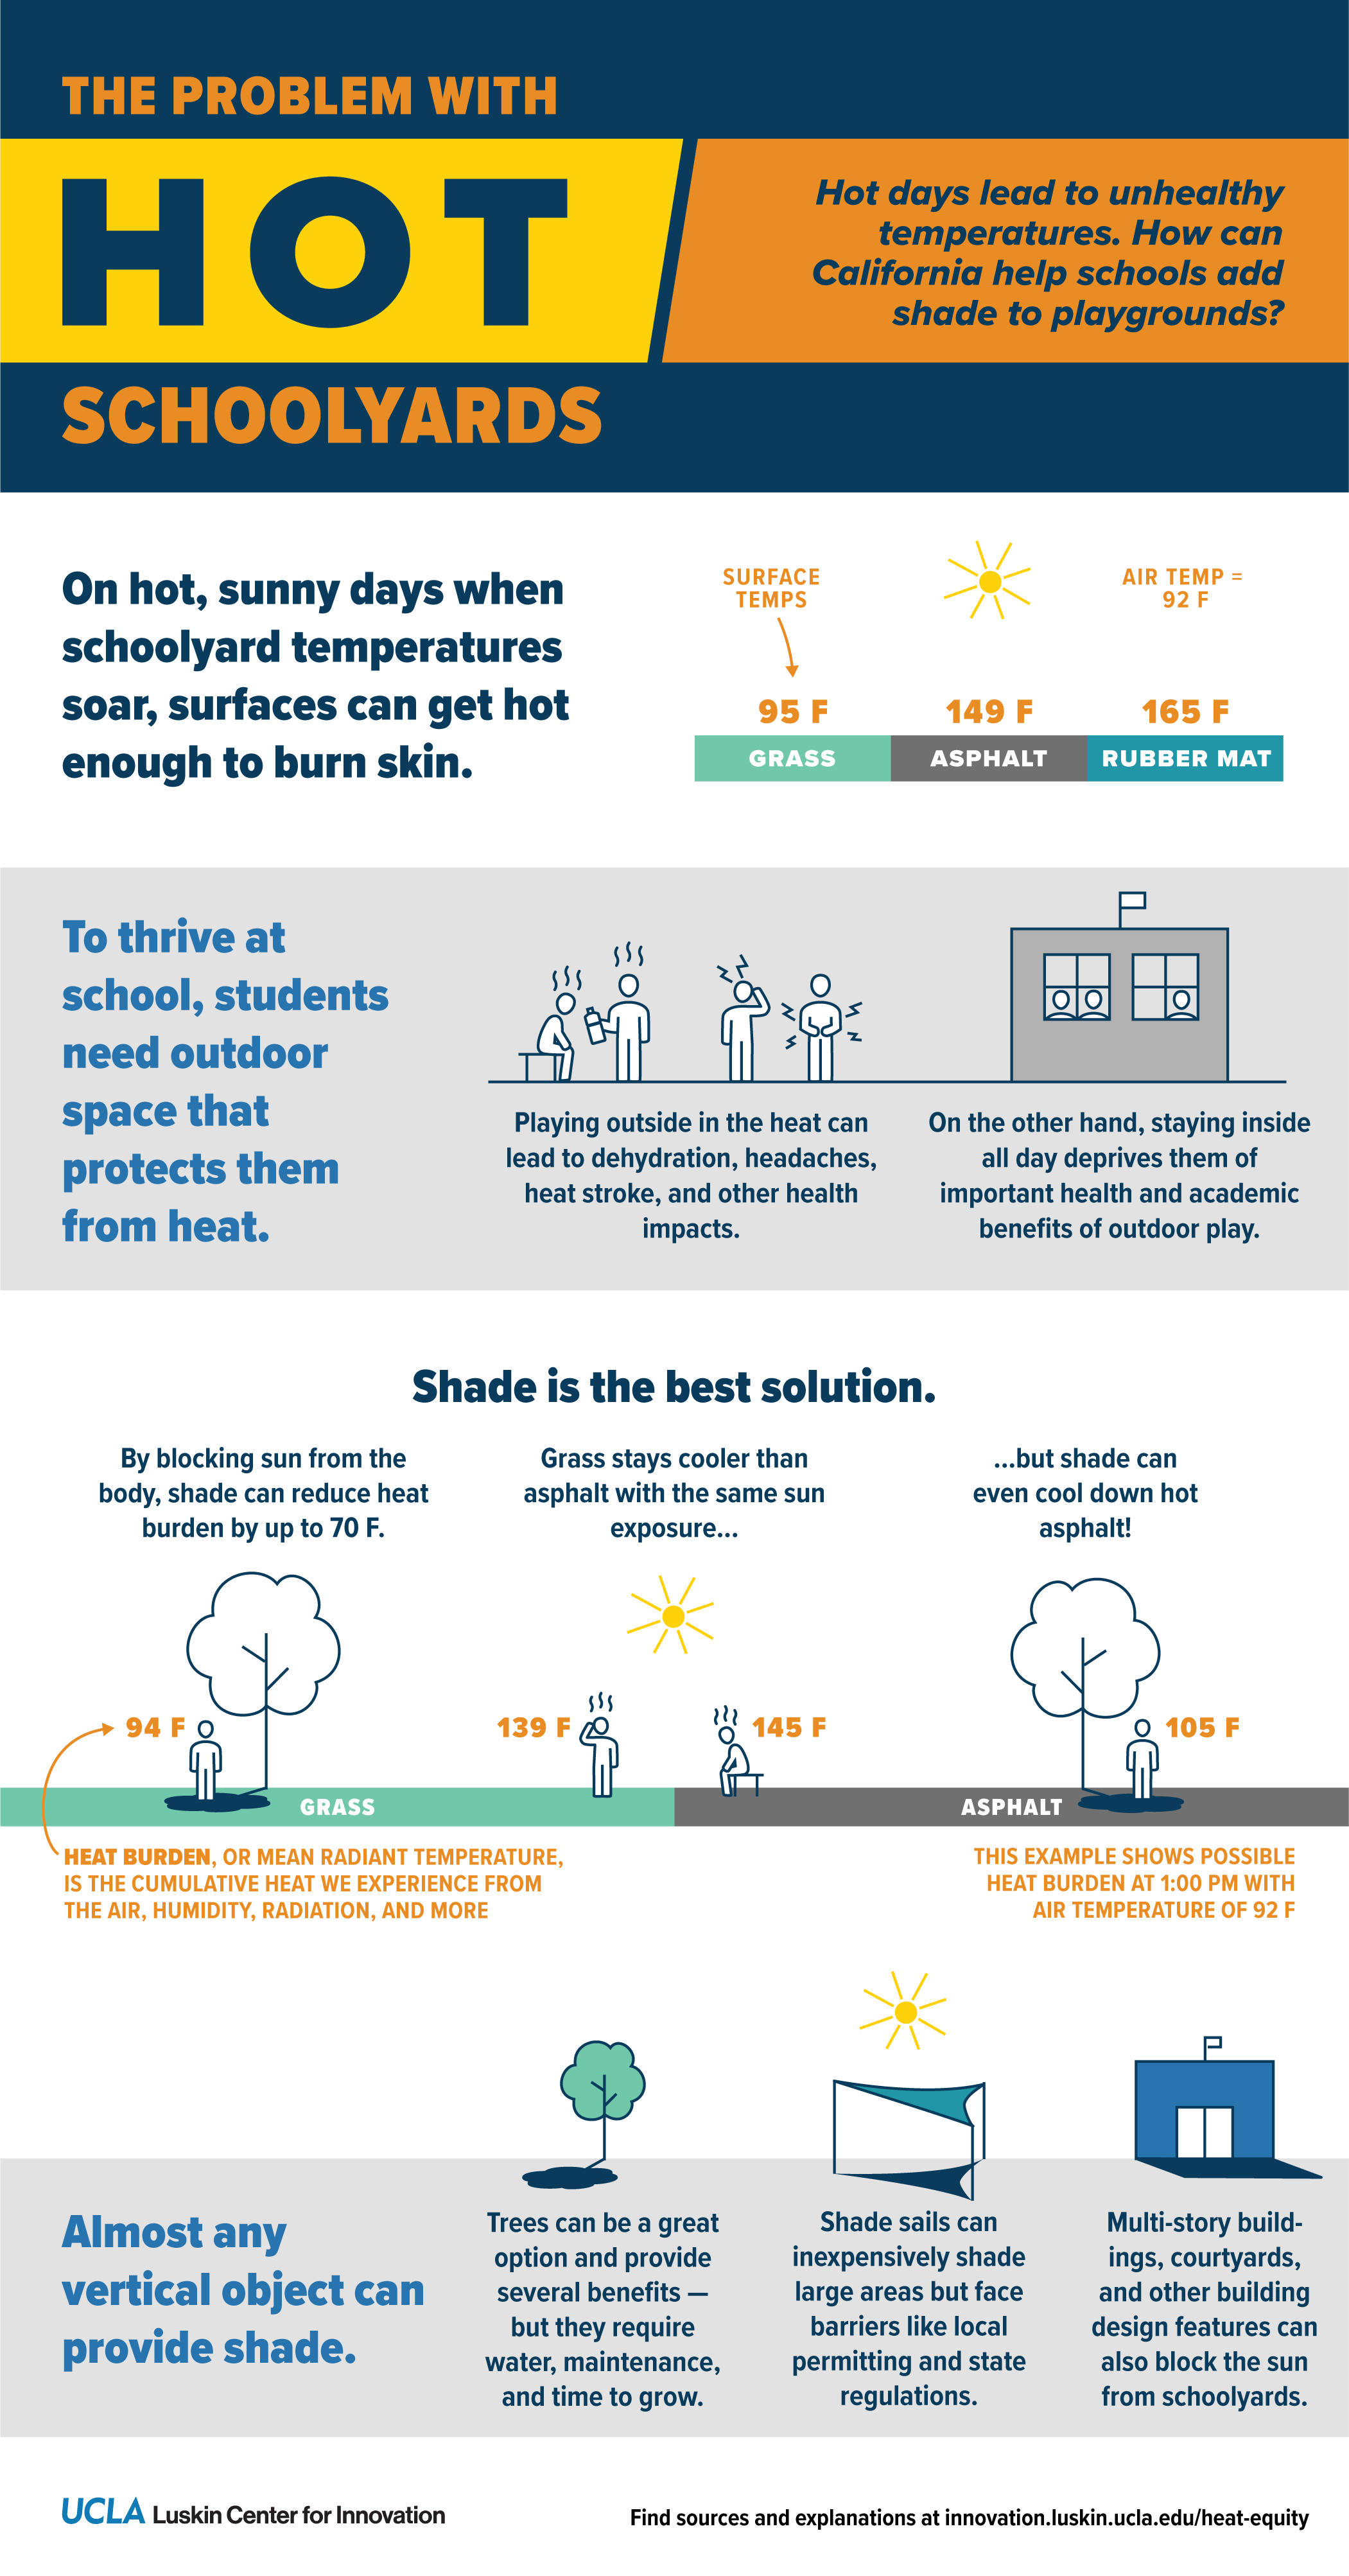
This infographic lays out some basics to illustrate why overheated outdoor play areas are a problem for students. Here are some contextualizing details and citations:

  • Surface temperature: The surface temperatures listed in the graphic are actual temperatures measured at or near an elementary school in Pacoima, a neighborhood in Los Angeles. The measurements were taken when the air temperature was 91 to 92 degrees Fahrenheit. Source: Turner et al. 2023. “Site Design and Human Heat Burden in Pacoima, California.”
  • Heat burden: Heat burden is a colloquial term for mean radiant temperature, or MRT, which measures the net heat exposure from multiple sources: air, humidity, wind, incoming short and longwave radiation, radiant heat from surface, etcetera. The numbers for heat burden in this graphic come from a model that estimates MRT for different shade and surface scenarios at 1:00 pm at that same school in Pacoima. Source: Turner et al. 2023. “Site Design and Human Heat Burden in Pacoima, California.”

To learn more, read our fact sheet, “Protecting Students from Heat Outdoors,” or our policy brief, “Protecting Californians with Heat-Resilient Schools,” both of which are accessible here.

The Problem with Hot Classrooms
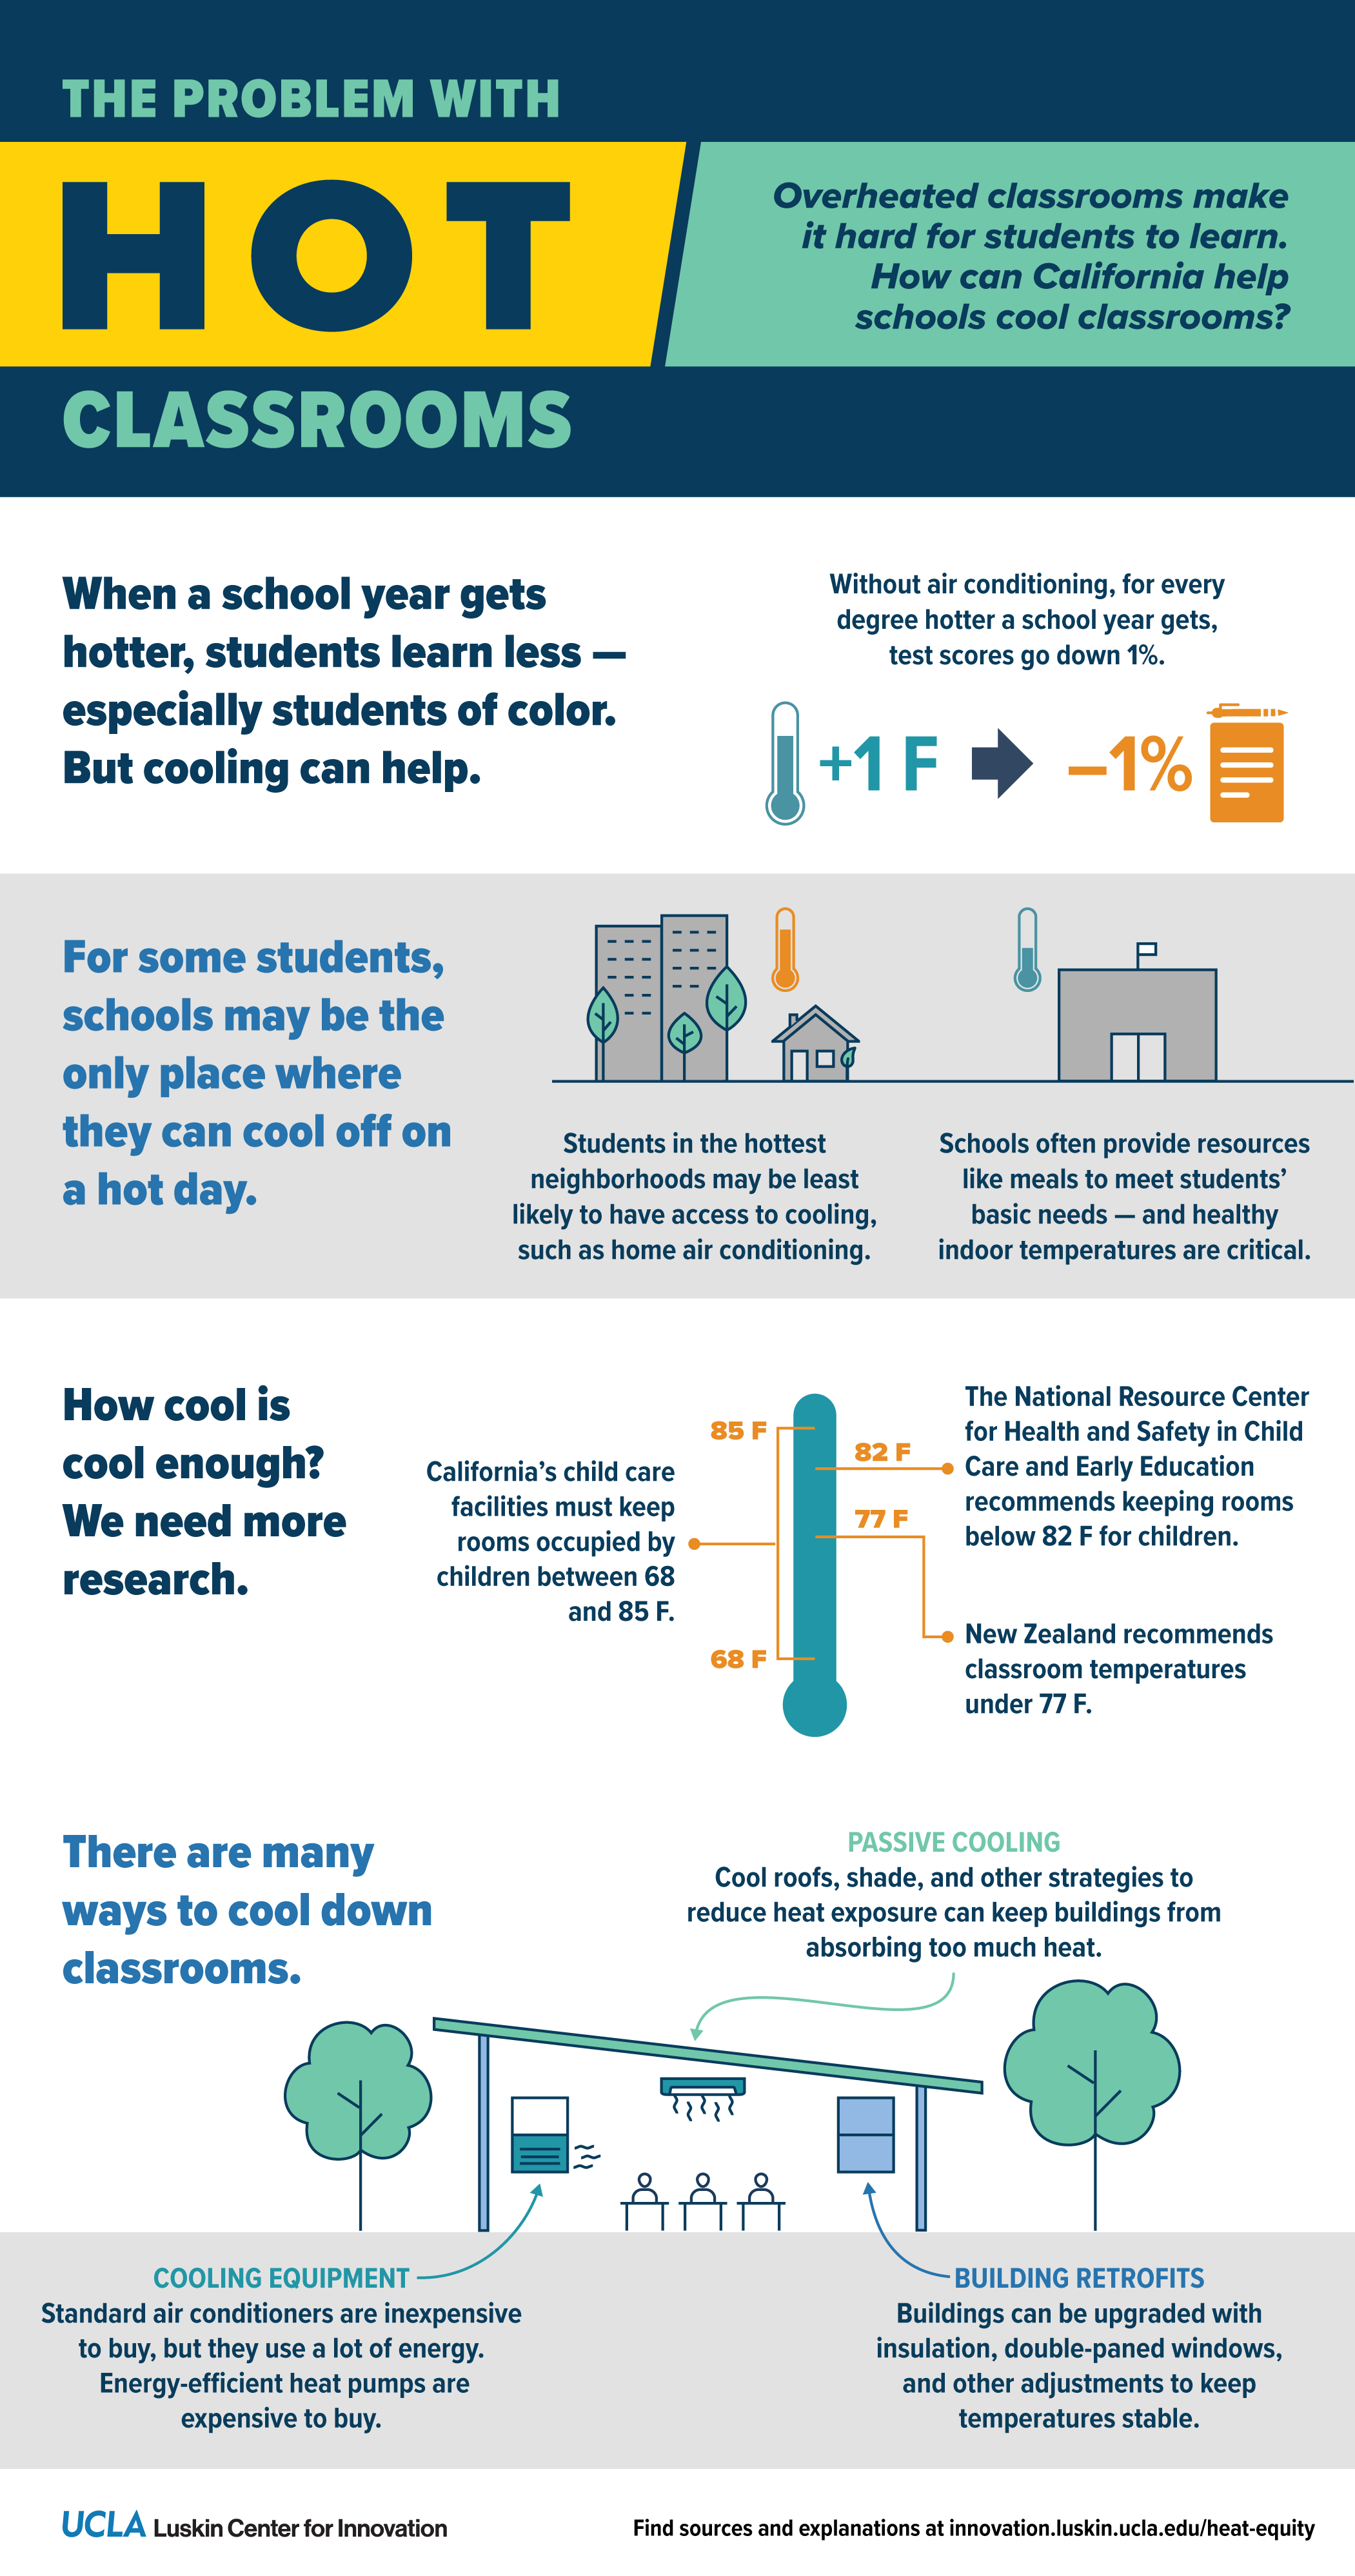
This infographic lays out some basics to illustrate why overheated classrooms are a problem for students. Here are some contextualizing details and citations:

  • Test scores: Park and colleagues (2020) showed that without cooling equipment in classrooms, an increase in average school year temperature of 1 degree Fahrenheit leads to 1% less learning for that year, as measured by changes in test scores. Source: Park, R. Jisung, Joshua Goodman, Michael Hurwitz, and Jonathan Smith. 2020. “Heat and Learning.” American Economic Journal: Economic Policy, 12 (2): 306-39.

To learn more, read our fact sheet, “Cooling Classrooms to Healthy Temperatures,” or our policy brief, “Protecting Californians with Heat-Resilient Schools,” both of which are accessible here.

Authors

  • V. Kelly Turner, associate director
  • Ruth Engel, project manager for environmental data science
  • Lauren Dunlap, project manager for energy research

Funding Acknowledgements

Funding for this project was provided by the Resources Legacy Fund.

More Recent Climate Research

Are our efforts to address climate change doomed due to partisan politics?

September 7, 2023
Democratic unity and initiative, as well as Republican states’ clean-energy markets and extreme weather, may help efforts to address climate change
https://innovation.luskin.ucla.edu/wp-content/uploads/2023/09/capitol1.png 400 495 admin https://innovation.luskin.ucla.edu/wp-content/uploads/2024/07/web-headers-2024-07.png admin2023-09-07 08:42:202026-02-05 11:36:50Are our efforts to address climate change doomed due to partisan politics?

The heat is rising, and UCLA research is helping L.A. respond

August 17, 2023
Environmental justice has been the cornerstone of Luskin School efforts related to the city’s hot weather policies
https://innovation.luskin.ucla.edu/wp-content/uploads/2023/09/heat-rising.png 400 495 admin https://innovation.luskin.ucla.edu/wp-content/uploads/2024/07/web-headers-2024-07.png admin2023-08-17 16:42:092026-02-05 11:45:07The heat is rising, and UCLA research is helping L.A. respond
Edith de Guzman

Welcome to our new water equity and adaptation policy expert, Edith de Guzman

July 31, 2023
Learn more about her research advancing climate resilience and access to clean water and sustainable resources.
https://innovation.luskin.ucla.edu/wp-content/uploads/2023/07/Edith-de-Guzman2.png 400 495 Nick Cuccia https://innovation.luskin.ucla.edu/wp-content/uploads/2024/07/web-headers-2024-07.png Nick Cuccia2023-07-31 14:48:202026-02-05 11:52:55Welcome to our new water equity and adaptation policy expert, Edith de Guzman
Page 7 of 18«‹56789›»

© Copyright – UCLA Luskin Center for Innovation – Enfold WordPress Theme by Kriesi
Terms of Use
The UCLA Luskin Center for Innovation acknowledges the Gabrielino/Tongva peoples as the traditional land caretakers of Tovaangar (the Los Angeles basin and So. Channel Islands). As a land grant institution, we pay our respects to the Honuukvetam (Ancestors), ‘Ahiihirom (Elders) and ‘eyoohiinkem (our relatives/relations) past, present and emerging.
3323 Public Affairs Building, Box 951656, Los Angeles, CA 90095-1656
Phone: 310-267-5435 | Fax: 310-267-5443
Scroll to top Scroll to top Scroll to top