Who will be most impacted by rising temperatures in California?
New online mapping tool helps the state prepare for extreme heat
Last summer was the hottest in California’s history. And as this summer kicks off, we’re bracing for more record-breaking temperatures.
Heat is the deadliest effect of climate change in California. While it affects everyone, it disproportionately impacts low-income residents and communities of color.
“Heat is an equity issue. Neighborhood by neighborhood, we’re going to be experiencing heat differently,” said Colleen Callahan, co-executive director of the UCLA Luskin Center for Innovation. “That’s why it’s important to identify where protections are most needed, and where they’ll have the biggest impact.”
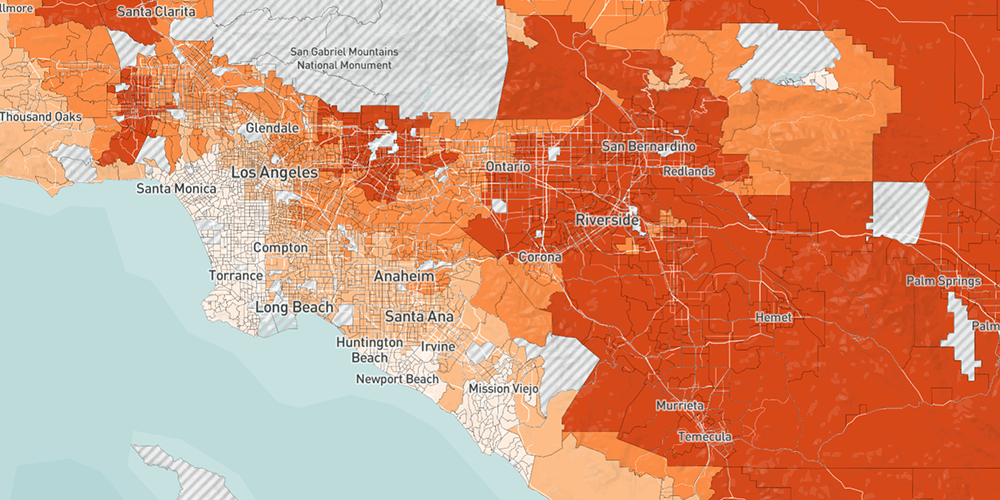
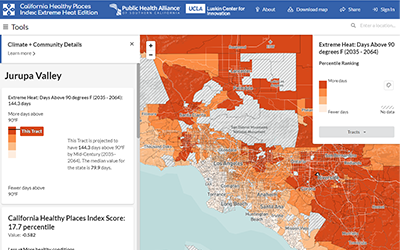
A new tool does just that. The California Healthy Places Index (HPI): Extreme Heat Edition helps the state ramp up its efforts to prepare for rising temperatures — visualizing where and who will be most affected in the coming decades. It was developed through a joint partnership between the UCLA Luskin Center for Innovation and Public Health Alliance of Southern California.
The tool allows users to explore several questions:
How hot will it get? As the climate changes, how many days are temperatures expected to soar above 90°F in your community? What about 100°F?
Who is vulnerable? Certain groups — such as children, older adults, and people with a disability — can be particularly sensitive to extreme heat. The tool shows where these at-risk populations may be most susceptible to heat risks based on where they live.
How resilient is my community? Community conditions like shady trees, parks, and clean air factor into the well-being of a neighborhood. Detailed data allows you to assess your community’s resilience to climate change.
What types of resources are available? Many funding programs exist to prepare for rising temperatures. The tool illustrates state level resources, like programs that provide air conditioners to low-income households and fund local urban greening.
Importantly, the HPI: Extreme Heat Edition shows how these themes intersect, illustrating where heat exposure, at-risk populations, and community conditions overlap to increase vulnerability.
View the technical report
Watch the demo webinar
Researchers created the tool collaboratively with a variety of audiences in mind. For instance, the tool provides data at the school district level, so that educators can understand how their risk compares to nearby districts. They can also see what funding programs are available to weatherize their classrooms and playgrounds.
Other users, like state agencies, nonprofit organizations, and local and tribal governments, can use the tool to identify where to target investments. At the household level, residents can find programs to make their home more energy efficient, help pay for energy costs or install rooftop solar panels to provide cheaper electricity.
“Open and accessible data on extreme heat impacts, linked with opportunities and funding sources, is key to empowering communities to build healthy, resilient neighborhoods. The California HPI: Extreme Heat Edition makes these data actionable through an interactive, easy-to-use tool,” said Tracy Delaney, PhD, the founding executive director of the Public Health Alliance of Southern California.
Funding for the tool was provided by the California Strategic Growth Council’s Climate Change Research Program. The tool builds upon the Luskin Center for Innovation’s portfolio of research on climate change impacts and resilience strategies, with a focus on extreme heat. This includes a statewide heat policy gap analysis that has supported the state’s new Heat Action Plan, heat related investments, and Assembly Bill 2076.
UCLA continues to lead on research to help California prepare for a hotter future under the climate crisis. The tool also adds to UCLA’s broader portfolio of resources — including a soon-to-be-launched tool created by the UCLA Center for Healthy Climate Solutions that examines excess emergency room visits for heat related problems at the zip code and county levels.
For more of the UCLA Luskin Center for Innovation’s work on extreme heat, visit our climate adaptation and resilience webpage. For more information on the Public Health Alliance and their initiatives, including the Healthy Places Index 3.0, visit their website.


 Photo credit: Mark McClure / Flickr (CC BY-NC-ND 2.0 license)