
Utility Consolidation to Achieve Health Equity
This article was originally posted by the Environmental Policy Innovation Center (EPIC). The UCLA Luskin Center was proud to partner with EPIC on this project.
The immense number of small drinking water systems in the U.S. exacerbates the water sector’s challenges. Small utilities have a smaller customer base and are thus vulnerable to shocks such as population loss, changes in the local economy, or weather patterns. They also have trouble hiring and retaining qualified operators, have few resources to improve their overall infrastructure, and are more likely to experience water quality violations. At current rates, it will take approximately 110 years for sufficient utility consolidation to occur to reach our or other experts’ recommended levels of consolidation to achieve public health goals. That is an unacceptably long wait for some communities currently served by small systems to seek sustainable water systems that provide reliable, safe, and affordable water services.
WATER SYSTEM STRUCTURE: BACKGROUND
Roughly 87% of the U.S. residents receive piped water from a water utility and the rest rely on private water wells. The number of utilities that provide water services in the U.S. is dramatically different from other infrastructure sectors, due to a history of permissive policy regarding small water system formation, even in dense urban areas. There are more than 50,000 community water systems that supply water to the same people year-round. By comparison, there are around 3,300 electric utilities, 2,600 internet service providers, and 54 state and territorial highway agencies.
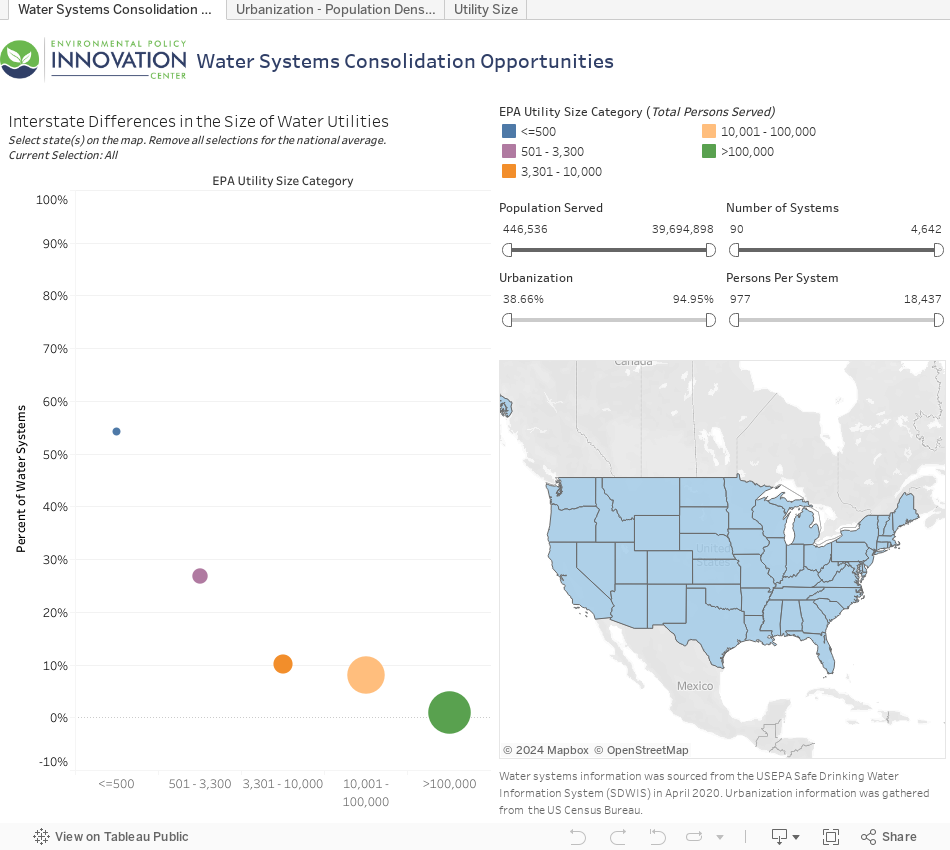
Nearly 90% of the water utility systems in the United States serve less than 10,000 people and more than half serve less than 500 people. This exacerbates the water sector’s challenges such as aging infrastructure, affordability, technical know-how to deal with contaminant pollution, and sustainability especially in light of climate change. Small utilities that produce only thousand gallons per day are disadvantaged by their size. They have a smaller user base to charge and are thus vulnerable to shocks such as population loss, changes in the local economy, or weather patterns. Additionally, small utilities have trouble hiring and retaining qualified operators, have few resources to improve their overall infrastructure, and are more likely to experience water quality violations. They often lack resources to keep track of and apply for government grants that are specifically targeted for small utilities.
CONSOLIDATION
To resolve many of these concerns, there is a renewed effort across the country to take advantage of the process of physical or managerial consolidation. Struggling utilities have consolidated to provide high quality water and wastewater services, improve resilience, reduce costs to consumers, and modernize their water infrastructure. Importantly, system consolidation stands to promote health and financial equity because the smallest utilities disproportionately serve isolated, rural, and lower-income communities. There are few if any circumstances foreseeable in which a large fraction of these utilities which are currently under-performing can provide safe and sustainable water in the future.
POLICY BRIEF
 State policies on consolidation and system governance play a greater role than federal policies on the number of systems in an area and the reliability of their service. Using publicly-available EPA data, we created a new, interactive tool to visually analyze the structure of community water systems across states. This tool helps identify patterns among states and provides an easy-to-use first step to assess consolidation opportunities at the state level. States similar in population, density, and urbanization have achieved different levels of consolidation by pursuing different policies.
Explore the visualization tool.
This tool is comprised of a series of Tableau dashboards and utilizes charts, maps, and filters to enable the identification of states that differ from national and regional trends based on data from EPA’s Safe Drinking Water Information System (SDWIS), supplemented by urbanization data from the U.S. Census Bureau. Data from SDWIS and Census Bureau were collected in April 2020.
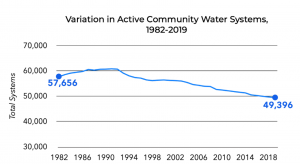
Over the last few decades, the total number of community water systems has declined at a gradual rate, from a peak of 60,743 in 1991 to a current number of approximately 49,000 in 2019. Currently, there is no consensus among experts on the ideal utility size or how many utilities should exist in a state or county, although several proposals have been made, and momentum is growing to reduce the number of utilities dramatically. Earlier this year, Environmental Policy Innovation Center recommended that the EPA set a national goal to bring down the number of utilities by 75% in the next 20 years to improve health outcomes for millions of rural residents. Based on the historical rate of consolidation, the total number of systems would still be roughly 43,000 in twenty years, while reaching the goal of 75% reduction to 12,500 systems would only occur in the 2130s. It is clear that policy changes must be made in order to facilitate the volume of consolidation necessary to result in meaningful health outcomes.
VISUALIZATION TOOL
Consolidation policies, including prioritization of State Revolving Fund monies, vary among states, as do urbanization levels which generally correlate with more consolidated utility arrangements. To compare and identify states with potentially promising policies, we developed a Community Water System Consolidation Analysis tool for public use. This tool is comprised of a series of Tableau dashboards, utilizing charts, maps, and filters to enable the identification of states that differ from national and regional trends based on data from EPA’s Safe Drinking Water Information System (SDWIS), supplemented by urbanization data from the U.S. Census Bureau. Data from SDWIS and Census Bureau were collected in April 2020. If the dashboard does not load or respond properly, click here to view it on Tableau directly; an alternate version can be seen here.
KEY INSIGHTS
Examples of state effectiveness in achieving consolidated utilities can most easily be identified in the South. Kentucky, Alabama, and Tennessee all stand out as states with an average of more than 10,000 persons per system despite fairly low rates of urbanization. Kentucky is known for pursuing aggressive consolidation by reorganizing its institutional structure, but neighboring Tennessee and Alabama have a similar composition of utilities. Highly urbanized New England is served primarily by systems with 10,000-100,000 persons. The West follows a similar trend for urbanization and persons per system as the Northeast. In the West and out of all the states, Nevada has the highest percent of population served by 100,000+ person utilities, whereas Wyoming contains no very large utilities. Finally, in the Midwest, there is a wide degree of variation in system density in each state.
Pennsylvania and Ohio are politically and demographically similar states, while Pennsylvania and Georgia would initially appear to have less in common. Our tool, however, shows similar rates of urbanization across all three states (~75%), and a measurably-reduced spread of systems across size categories in Ohio as compared to Pennsylvania and Georgia. Both Pennsylvania and Georgia are far more comparable in terms of utility size distributions, presenting Ohio as a case for further study to policymakers in both states. Nebraska and Nevada are among the 10 least-densely populated states in the country, at approximately 25 persons per sq mi. However, Nevada’s population distribution around Las Vegas has allowed 85% of the state’s population to be served by large systems.
We encourage policymakers and practitioners to use this tool to further understand state-level differences and inform planning efforts. We also encourage other researchers to develop similar, user-friendly tools to further democratize publicly-available, but often hard to access data on drinking water systems.

